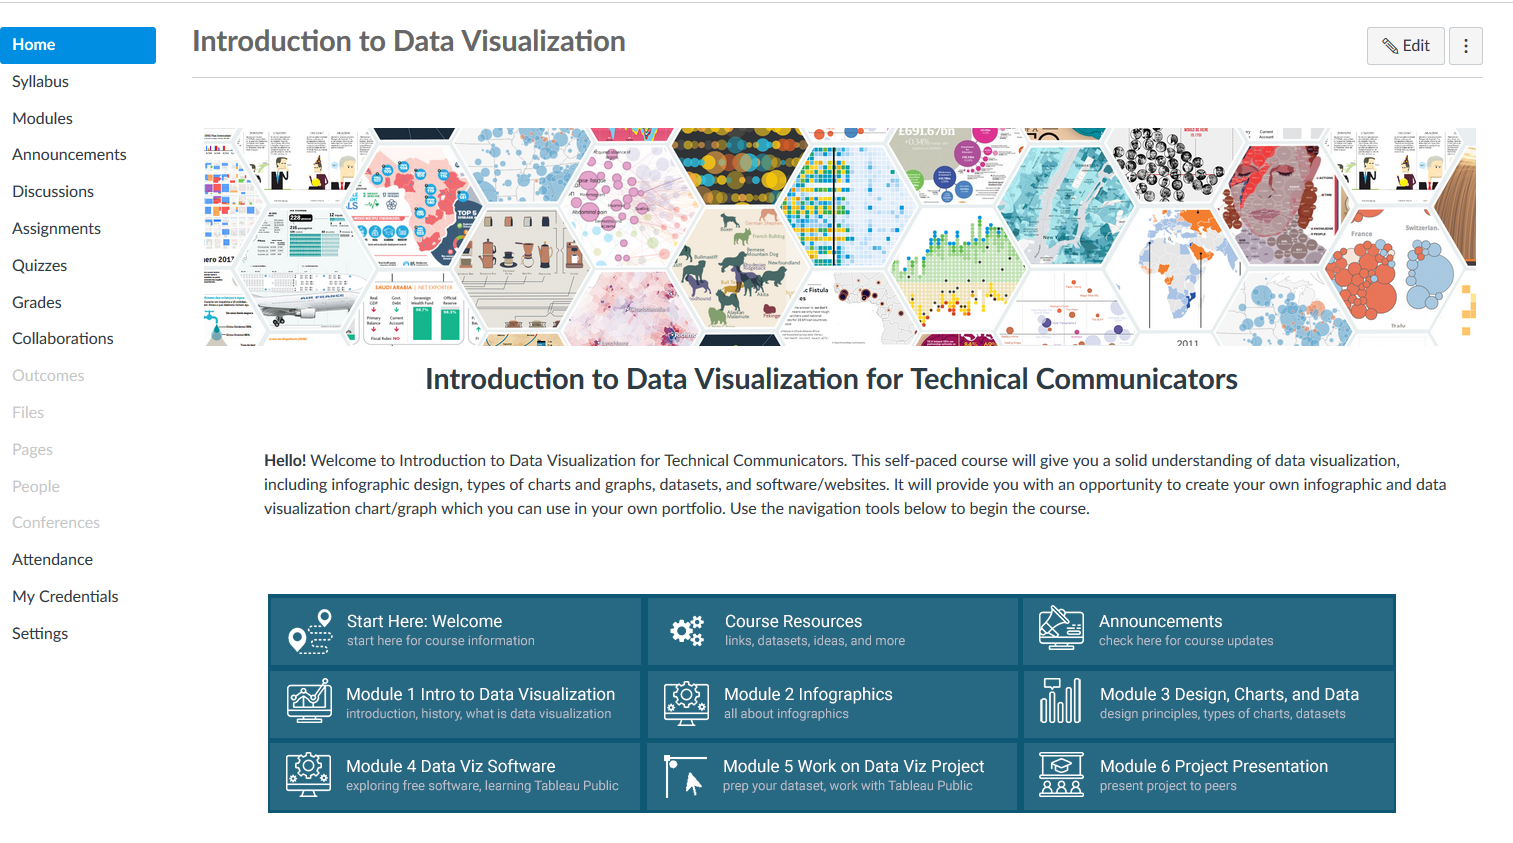
I developed a course in Canvas titled Introduction to Data Visualization for Technical Communicators. This self-paced course is intended to give the learner a solid understanding of data visualization, including infographic design, types of charts and graphs, datasets, and software/websites. The course provides the learner with an opportunity to create their own infographic and data visualization chart/graph. Included below is a link to the course syllabus and a link to a quiz I created using Articulate Rise.
Course Assets:
Syllabus
Articulate Rise Charts and Assessments Quiz
Course: INTE5200 Crafting eLearning Experiences